Decisions from data, not gut feel.
A 30-day analytics suite across four views, and a report engine that exports the numbers to CSV and Excel when you need them out of the system.
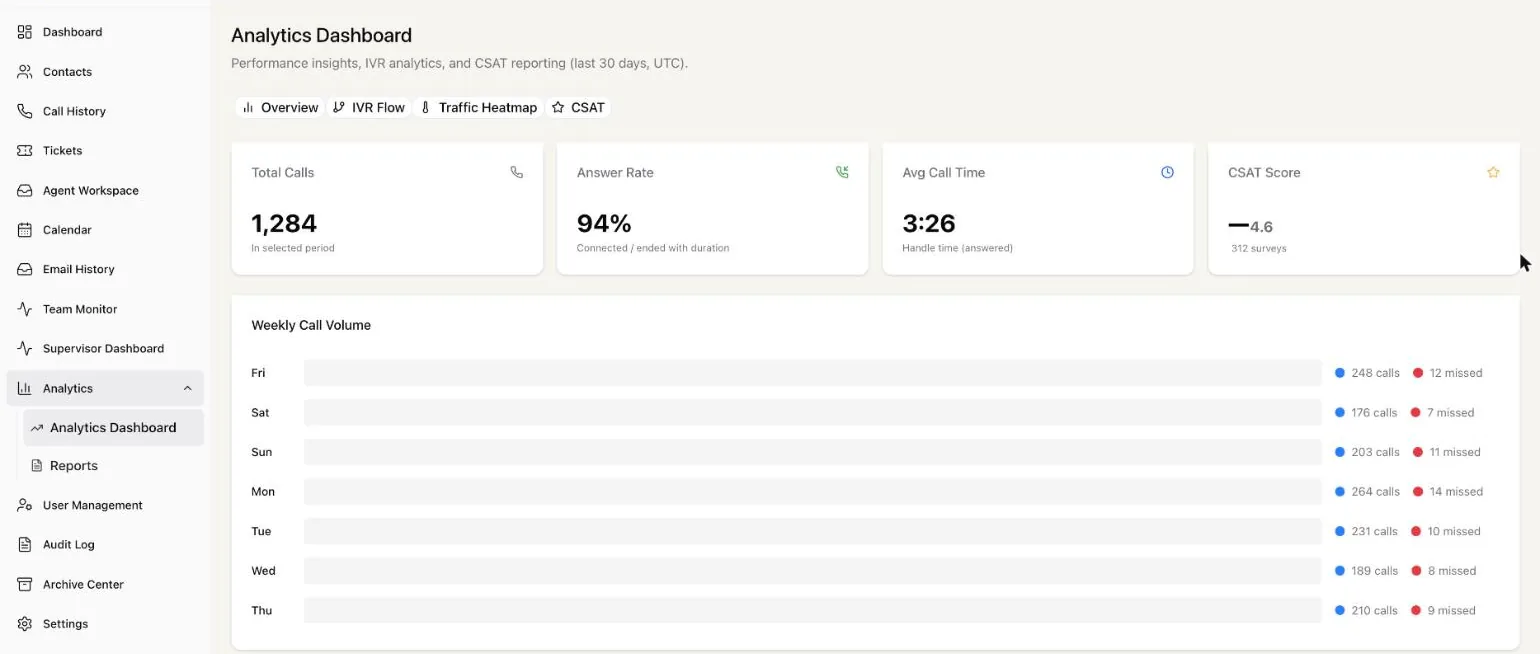
Four views on the same operation.
Overview for the headline health of the floor, IVR Flow for how callers move through menus, a 24×7 heatmap for when demand actually lands, and CSAT for what customers thought.
- Overview: total calls, answer rate, AHT, FCR, abandon, CSAT, top performers
- IVR Flow: normal path versus where callers drop off
- 24×7 traffic heatmap by weekday and hour
- CSAT: average score, surveys, promoter rate, distribution and comments
A report engine with real exports
Generate reports with filters for date range, department, user and extension, then view or export the results to CSV and Excel, or export everything at once.
See demand before it hits
The 24×7 heatmap turns a month of call volume into a single glance at your busiest hours: the input every staffing decision needs.
Analytics reflect your data, not a highlight reel.
Every screenshot here uses illustrative demo data. In your workspace, the numbers are yours: the reporting engine and export tools are built in, and the catalog grows as your reporting needs do.

Move fast, stay dynamic.
See your own contact center, shaped your way, running on DYNAMiC in a live demo.
Book a demo